The Run tab
Audience: operators during an active run. Scope: the live-run console — state badge, Start / Stop / Emergency buttons, plot pane. Sibling docks (numerics, events, log, manual control) are documented separately.
The Run tab is small on purpose. It owns the one-line answer to what is the rig doing right now? and the three buttons that change it. Live data lives in the plot pane in the centre; numbers, events, and the operator-control surface live in docks around it.
Anatomy
┌──────────────────────────────────────────────────────────────────────┐
│  Running    sample: A12  ·  procedure: free_run  ·  Free run         │
│  00:01:42                                  [Start] [Stop run] [⛔ Emergency]
├──────────────────────────────────────────────────────────────────────┤
│                                                                      │
│                    Plot pane (PyQtGraph)                             │
│                                                                      │
│     One subplot per channel group, time on the x-axis,               │
│     channel-specific units on the y-axis.                            │
│                                                                      │
│                                                                      │
└──────────────────────────────────────────────────────────────────────┘
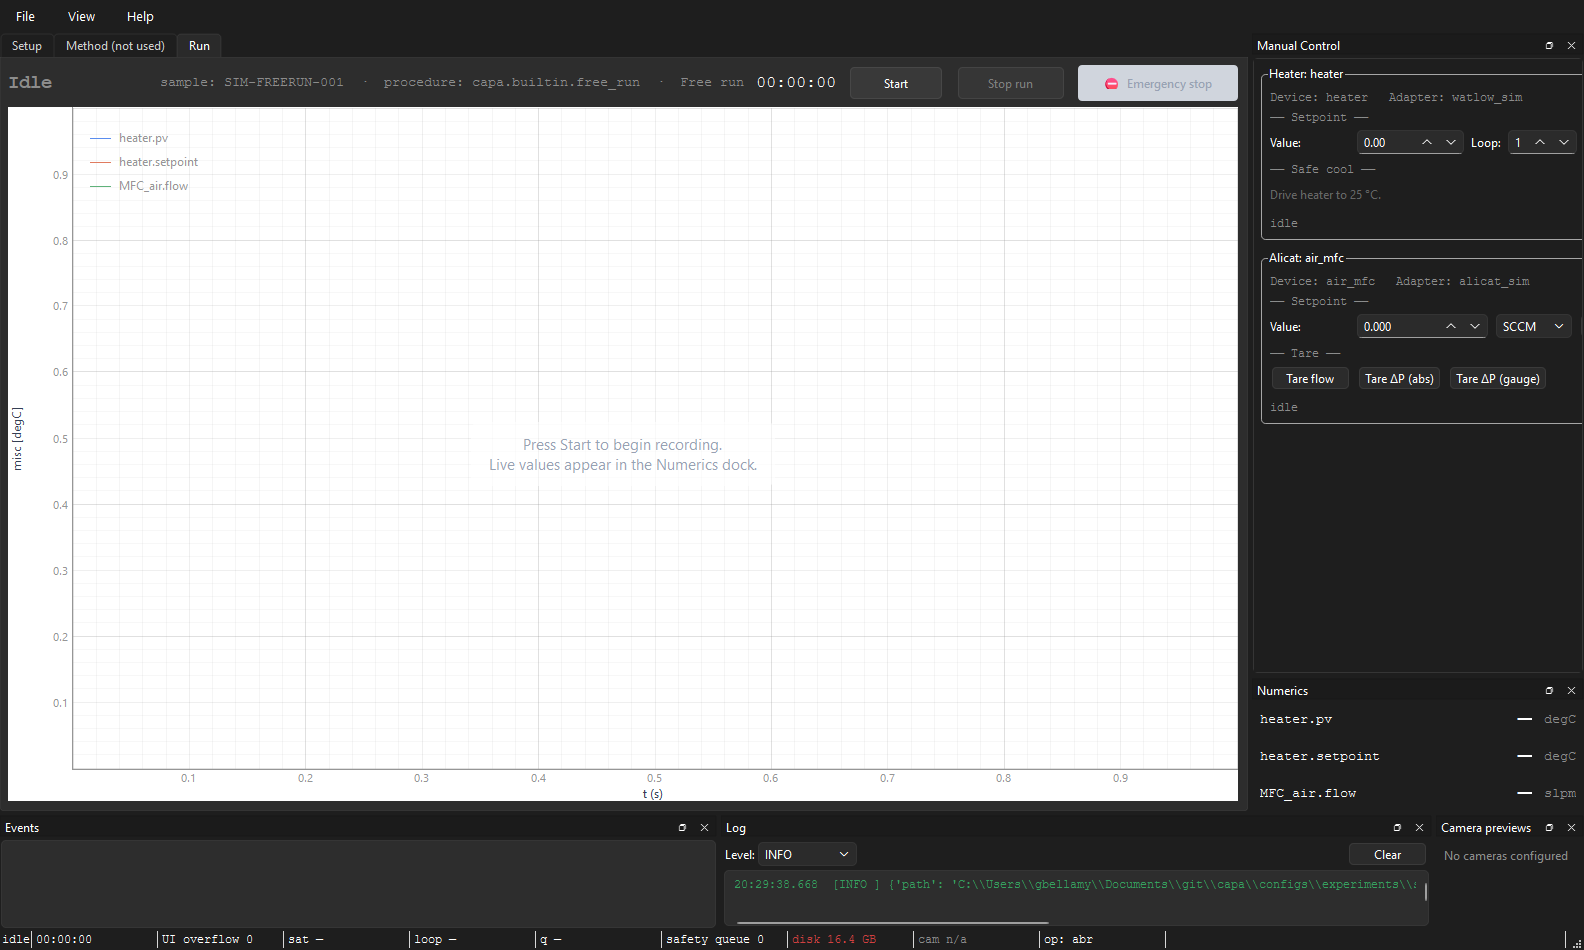
The header carries:
- The state badge (left): a monospace, bold word in a colour that matches the lifecycle.
- The run identity line:
sample: <id> · procedure: <id> · Mode. Mode is eitherFree run(no method loaded) orMethod: <name>. This is the same triplet the prior status strip carried — now folded into the header so the Run tab has one "what's loaded" surface above the plot. - The elapsed timer: monotonic seconds since Start, refreshing once per second. Wall-clock drift never affects it.
- The three control buttons (right): Start, Stop run, Emergency stop.
The state badge
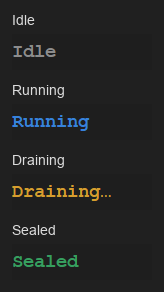
The badge cycles through seven values. Each maps to a colour from the shared palette (theme.py):
| State | Display string | Colour | Meaning |
|---|---|---|---|
IDLE |
Idle |
gray | No conductor. Pool may be open (between runs) or closed (no config loaded yet). |
PREPARING |
Preparing… |
warn | Conductor is opening the session and arming workers. |
RUNNING |
Running |
running (green) | Procedure is running; samples flowing. |
DRAINING |
Draining… |
warn | Procedure ended (naturally or by abort); workers disarming. Manual writes refused. |
FINALIZING |
Finalizing… |
warn | Bundle is being rewritten and sealed. |
SEALED |
Sealed |
ok (green) | Bundle finalized cleanly. Previous run's result is inspectable. |
FAILED |
Failed |
fail (red) | Bundle finalize itself failed, or the run never reached SAMPLING (preflight refusal, pool-open failure). |
Four of these — PREPARING, RUNNING, DRAINING, FINALIZING — are
write-blocked states: the manual control dock
refuses commands during them because the conductor owns the workers.
The four canonical colours, side-by-side:
After a run finishes, the badge stays on SEALED (or FAILED) until
the next Start brings it back to PREPARING. There is no automatic
reset to IDLE.
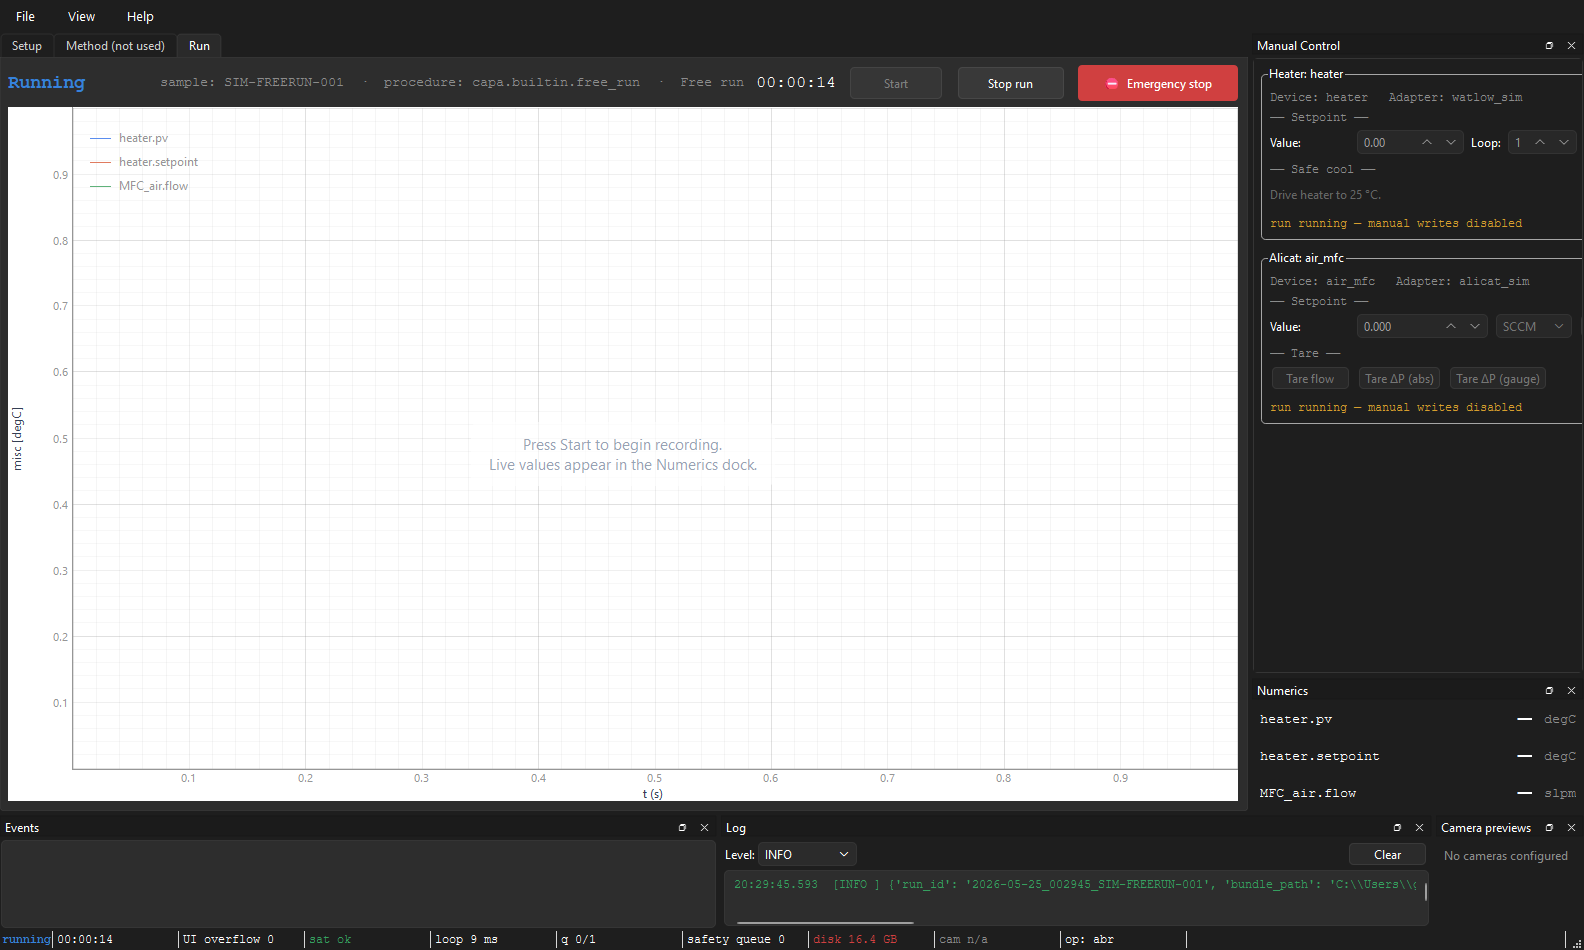
Mid-run, the badge is green and both abort buttons are armed:
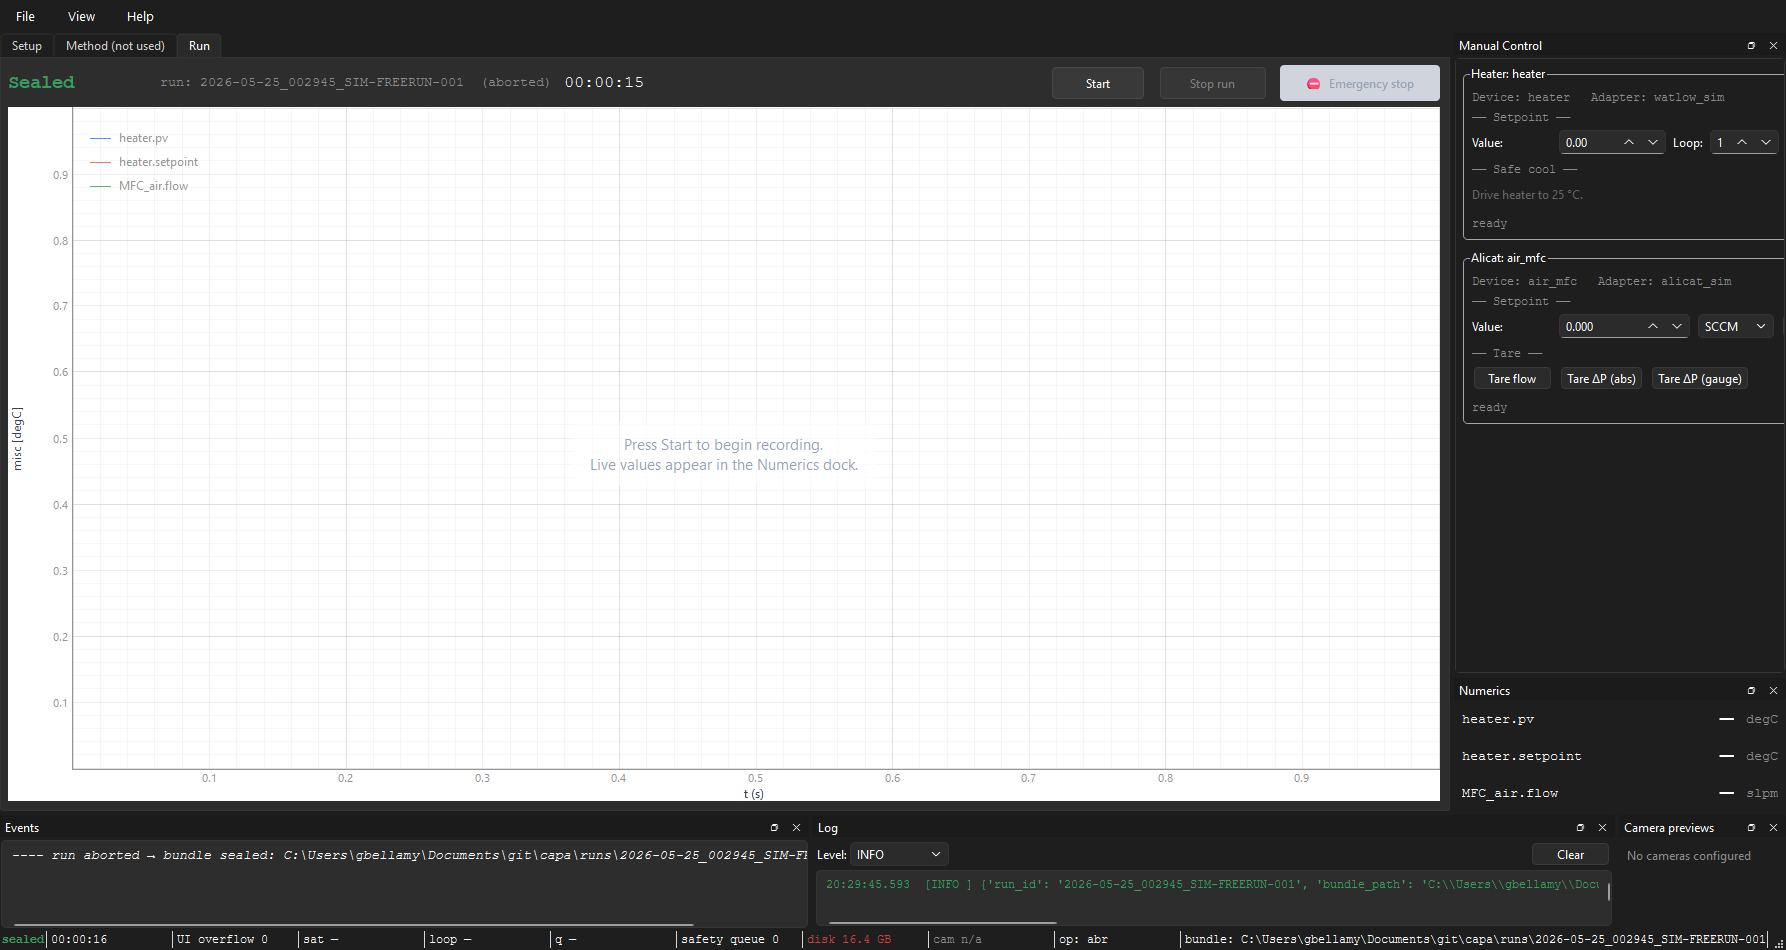
After Stop, the badge moves to Sealed, the run-id line picks up the
final run_status, and the events dock prints the sealed bundle path:
The three buttons

Start
Begins a new run with the currently-loaded config.
Enabled when all of:
- A config is loaded.
- No run is already active (
controller.is_activeisFalse). - The worker pool is open (
PoolState.OPEN). - Hardware is ready (
hardware_readyflag from the controller).
If you click Apply & Connect and the Start button stays grey, the most
likely cause is that the pool is still OPENING — which would crash
the conductor's preparation with PoolStateError. Watch the
connection strip on the Setup tab
flip CONNECTING → CONNECTED, then Start will light up.
On click, Start does not open hardware — that happened at Apply & Connect. It rebuilds the channel ring buffers, swaps in a fresh plot pane, hands control to the conductor, and disables itself while the run is in flight.
Stop run
Single click. Requests a graceful abort —
controller.request_abort(mode="safe_shutdown"). The conductor records
exit_reason="operator_safe_shutdown", signals the active procedure to
unwind, disarms workers, and finalizes the bundle. A trailing method
SafeShutdownStep only runs if normal method execution reaches it or a
procedure explicitly invokes it during cleanup.
Always available during RUNNING. See
aborting safely for the full behaviour.
Emergency stop
⛔ Emergency stop is a hold-to-confirm button — press and hold for
1 second; a progress bar fills the button while you hold. Release early
and nothing happens.
The hold gate is intentional. A misclick on a one-hour run would lose the run; a misclick on an eight-hour overnight run is much worse. One second is short enough to feel responsive in a real emergency and long enough to abort a misclick.
On confirm, calls controller.request_abort(mode="immediate"). See
aborting safely for what immediate actually
does — the abort modes differ in their recorded reason and the
guarantees about cooldown timing.
Both Stop and Emergency seal the bundle. Neither loses recorded data.
The plot pane
A PlotPane subplot stack rebuilt twice per run:
- On config-load (Apply & Connect): an empty pane is built against a placeholder registry so axes and legends are visible before Start. You see "the plot is wired" without any line data.
- On the IDLE → RUNNING transition: the pane is rebound to the actual ring-buffer registry the conductor populated. Lines start appearing within one buffer-flush interval (default ~50 ms).
When the run finishes, the pane is stopped — it keeps showing the final data but no longer pulls new samples. The next Start tears it down and rebuilds.
Decimation, time windows, and channel grouping are configured per channel in the experiment YAML. See channel bindings for the knobs.
What you should watch during a run
The Run tab itself does not show distress signals. The status bar at
the bottom of the window does — and sat, loop,
q, and disk are the four pills worth glancing at every few minutes.
A healthy steady state for a simulator run looks like:
If any of those flip yellow or red, see status bar guide for what to check.
When the run ends
The badge moves to SEALED (clean exit, even after an abort) or
FAILED (preflight refused, or finalize itself crashed). The run-id
line is replaced with:
run: <run_id> (<run_status>)— on a sealed bundle.run_statusis one ofcompleted,aborted, orcrashed.run refused: <reason>— when no bundle was produced (typically preflight refused before opening anything).
The bundle's full path is also stamped into the status bar's bundle:
pill. From there see reviewing a run.
The Start button comes back enabled one event-loop tick after the run
finishes (the underlying task needs a tick to mark itself done()),
so a quick click immediately after SEALED may briefly look ignored —
wait half a second.
See also: Status bar guide, Aborting safely, Manual controls, Reviewing a run, Runtime architecture.